
Biochemistry and DNA Technology
Organic Molecules Test Simulation
Cellular Respiration Simulation
Cellular Respiration Simulation Corresponding Handout
DNA Replication and Protein Synthesis Simulation
1) Explain the main sequence of events that occur within a cell that leads to protein synthesis. 2) Predict how changing the concentrations and interactions of biomolecules affects protein production. 3) Explain how protein production in a single cell relates to the quantity produced by a collection of cells.
1) Predict the effects on lactose metabolism when the various genes and DNA control elements are mutated (added or removed). 2) Predict the effects on lactose metabolism when the concentration of lactose is changed. 3) Explain the roles of LacI, LacZ, and LacY in lactose regulation.
1) What physically happens to the DNA when the mouse is licked? 2) How does this change the phenotype of the mouse?
Bacterial Transformation Simulation
Gel Electrophoresis Simulation
Evolution and Bioinformatics
1) What might the data look like if artificial selection was implemented in the breeding of a certain dewlap color?
1) Explain how each of the boxes at the top affect allelic frequency. 2) Why do your expected values sometimes not match what shows up on the simulation?
The Myths of Human Genetics: PTC Tasting
1) What was the outcome of the initial study (1935)? 2) What did the further studies show (1958, 1989)? How did their findings contradict the earlier studies? 3) What does this tell you about the importance of experimental setups? Drawing conclusions? 4) What was the significance of twin studies (1967)? Why monozygotic twins? 5) What gene is responsible for PTC tasting? What are the three main allelic genotypes for PTC tasting that represent 95% of all Europeans and Asian population? 6) If PTC tasting was controlled simply by simple mendelian genetics, what should have the outcomes been? What did they actually see? What allowed them to make the conclusion that PTC tasting is affected by other genes or environmental factors?
Cladogram Practice #1 Make sure you give the Shockwave Plugin permission to run!
More Cladogram Practice
Table: Cytochrome b DNA sequence differences between different species |
||||||
Species A |
Species B |
Species C |
Species D |
Species E |
Species F |
|
| Species A | - |
27 |
37 |
38 |
35 |
40 |
| Species B | 27 |
- |
13 |
19 |
20 |
21 |
| Species C | 37 |
13 |
- |
3 |
8 |
11 |
| Species D | 38 |
19 |
3 |
- |
12 |
14 |
| Species E | 35 |
20 |
8 |
12 |
- |
1 |
| Species F | 40 |
21 |
11 |
14 |
1 |
- |
1. Identify the most different, or ancestral, species . This is the one that has the most mutational differences from the other species. Place this all the way to the left. 2. Select the next most different, or ancestral species, the one that shares a common ancestor with the previous species Place this all the way to the right. 3. Add the next organism. To do this, look at the second organism's data and look for the most genetically similar organism (for that particular gene). 4. Continue doing this for the rest of the organisms. If an organism is most closely related to its predecessor instead the ones that are remaining, that might mean that those two species are on the same strand. 5. Then see which of the remaining organisms are most similar and start the next strand with that. Continue steps #3-#5 until done.
Virtual Fruit Fly Simulation - Download the Handout from the APBio Downloads Page
Photosynthesis and Transpiration
Watch Leaf Disc Lab Procedures
1. Write the procedures for the Leaf Disc Lab.
2. What is ET50? How do you measure it? Calculate the ET50 if you produced the data below:
3. Assume that you produced the data in the chart below. Calculate the mean, standard deviation and standard error for each set of data. What would happen to the standard error if you did more trials? Comment on the reliability of each set of data. What is the conclusion of the study? Provide a biological explanation for the conclusion.

Plant Pigment Chromatography Lab
Download the VirtualChromatographyLab handout from the downloads page to complete the above simulation
Waterweed Photosynthesis Simulator - Only works in Firefox Browser
Light and Plant Growth Simulation
1. Identify the dependent variable and how it is used to determine the rate of photosynthesis. 2. Collect and graph the appropriate data for EACH independent variable. Determine the trends for EACH independent variable. 3. What are the conditions that result in the highest rate of photosynthesis?
Body Systems
Use a graph like this to display your data

Use the equation below to calculate the Q10 for this experiment

Watch this video to help you calculate Q10
Animations page doesn't work so click here to view the Elisa Test video
Animations page doesn't work so click here to view the Western Blot Test video
Muscle Stimulation Virtual Lab
Ecology
Biodiversity and Community Health
Acid Rain and Accessing Water Quality
Female Choice, Fitness and Evolution
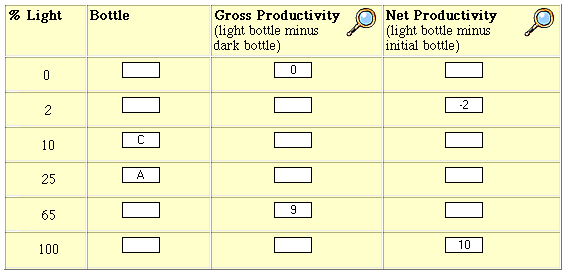
Primary Productivity & Dissolved Oxygen Lab
Complete this chart if the Sample Problem page chart is not working. (Hint: Match the amount of dissolved oxygen in each bottle with the percentage of light exposed to the bottle)
Watch The Perlious Plight of the Pika video when prompted by the case study